With climate change already an urgent challenge and buildings accounting for significant carbon emissions, sustainable design is more critical than ever.
For architects and designers to create sustainable designs, they need access to tools and data that can provide them with energy-related analysis much earlier in the design process.
Enter Enscape Impact, an exciting new add-on (in beta) from Chaos, the makers of the real-time rendering engine Enscape, and the global climate tech company IES.
This technical guide will provide you with an overview of Enscape Impact and guide you through how to get started and test the beta version.
Real-time insights for sustainable design
Enscape Impact is a building performance analysis add-on that’s integrated into Enscape (currently only for Windows). It enables architects and designers to perform baseline energy assessments in the early design stages, helping to make data-driven decisions that boost sustainability and efficiency.
With Enscape Impact, you can modify your design and evaluate a building's performance directly within your usual design environment, receiving feedback on basic metrics like peak loads, total operational carbon emissions, energy end use, energy use intensity, and more.
The Enscape Impact beta features include:
- Energy modeling simulation. See key metrics as you design, with data displayed directly in the render for easy comprehension and communication.
- Integrated workflow. Analyze energy efficiency and sustainability within your design process with seamless integration into popular CAD and BIM tools like Revit, SketchUp, and Rhino.
- Minimal data entry. Get actionable insights quickly with just a few data points, such as location and building type.
- Dials panel. Instantly see how geometry changes impact energy performance with simple charts and diagrams.
How to access Enscape Impact
To access the beta version, download Enscape 4.1. This is a free download for existing customers. New users can test Enscape for free for 14 days, which also provides access to Enscape Impact.
Once downloaded and installed, open Enscape and locate the Impact icon in the toolbar on the Enscape window. You can also press the hotkey ‘N’. This will open the Enscape Impact dashboard, which will be empty at first.
 |
Information required for building analysis
To see a baseline analysis of a building, some basic information is required.
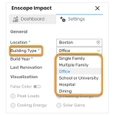
Click on the ‘Settings’ tab to start entering this information. There are three required fields: Location, Building Type, and Build Year. If your design software knows the location of your design, it should already be filled in. If not, you can add it in manually.
 |
The second required field is the Building Type. There are a few standard options to choose from, including single or multiple family, office, school, and hospital.
Next, you must add the Build Year. Here, you can select a date when the building was or will be constructed.
The fourth field asks you for the Last Renovation date of the building. This field is not mandatory.
Once these fields are completed, switch back to the dashboard to start the analysis, which will take a short time to process.
Visualizing building performance and energy efficiency metrics
Once the analysis is complete, you will have several metrics that provide a quick snapshot of a building's expected energy performance.
 |
Peak Loads: This is a sum of heating energy, cooling energy, internal gains, and solar gains to help determine the capacity needed for systems like HVAC (heating, ventilation, and air conditioning).
Total Carbon Emission: View predicted carbon dioxide emissions per year resulting from various building activities.
Energy Use Intensity (EUI): This metric quantifies a building’s energy consumption per unit area. A lower EUI indicates better energy efficiency.
Energy End Use: This refers to the specific purposes or applications for which energy is consumed within a building. Understanding energy end use helps identify opportunities for energy savings through more efficient technologies or behaviors.
To visualize the building analysis projected onto your model, switch back to ‘Settings’, go down to ‘Visualization’ and enable ‘False Color’. You can then select each of the four outputs (Peak Loads, Total Carbon Emission, Energy Use Intensitiy, Energy End Use) to review them in a color scale distributed onto the entire building.
Your model will turn white, and colors will be applied to reflect the results of the various outputs.
 |
Once False Color is active, you can choose between four visualization modes, Peak Loads, Heating Energy, Cooling Energy, and Solar Gains.
Watch the short tutorial video below to see a walkthrough of the instructions above.
Try Enscape Impact beta for free
Enscape Impact can perform baseline energy simulations directly within Enscape’s real-time visualization software and with the design application (Archicad, Revit, SketchUp, Rhino, or Vectorworks). Architects can now assess the energy performance of their buildings early in the design phase, leading to more sustainable designs.
Additional features will be added as the product evolves, but you can already try the free beta version of Enscape Impact now. Learn more here.


