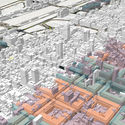
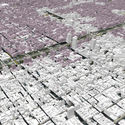
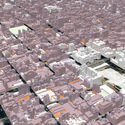
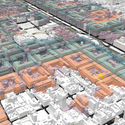

The Government of the City of Buenos Aires, through the Secretariat of Urban Development and the Secretariat of Innovation and Digital Transformation, has launched a new digital platform that allows users to visualize the city's Urban Code in 3D. The tool translates and clearly displays existing regulations, providing citizens with easy access to information on the layout of each district and approved construction parameters. What can be built in each neighborhood? What are the maximum heights for each plot? What are the permitted land uses? are some of the questions that can be answered using the platform.
- Related Article:
A three-dimensional map of the entire city of Buenos Aires, available for download and visualization

The project is divided into three phases, which will result in the 3D representation of 100% of the city's blocks. Phase 1 has already been published and is available for viewing. It includes the mapping of Buildable Units and Typical Block Corridors, which account for 44% of all blocks in the city. Subsequently, Phase 2 will add the Individualized Special Areas of Typical Blocks, representing 14% of the city, and Phase 3 will incorporate the Atypical Blocks, which represent the remaining 42%.

The platform aims to streamline the application process of the Urban Code (CUr) by converting its text into 3D layers. When overlaid on the city map, these layers make the regulations easier to read and understand. Ciudad 3D displays information related to: buildability—visualizing the building capacity of each plot, maximum heights and limit planes allowed under the Urban Code, buildability units, urban surplus value generated by a project, and the Total Occupancy Factor (FOT); permitted land uses for each lot; constraints—indicating specific conditions for each plot during design, flood risks in each neighborhood, building projections based on proximity to Aeroparque airport, public rights-of-way and public spaces, and potential street widening or openings; construction progress—providing information on certificates, building permits, and inspections carried out on each plot, issued by the City Government's Secretariat of Urban Development; and basic data with general information about each plot.

Ciudad 3D was developed as open-source software, licensed so that other cities or institutions can study, modify, and improve its design through the availability of its source code. The platform is based on the “Digital Twin” concept. This type of solution virtually replicates a city's urban layout in three dimensions. Using this technology, algorithms interpret the Urban Code and predictively model the development potential of each plot. The platform was developed in two parts: first, a data ingestion component where geographic algorithms process and integrate information with complementary data; second, a visualization component that displays this data in 3D and 2D alongside all necessary plot information. To achieve this, it retrieves data from an Application Programming Interface (API) and displays it on a front-end built with React and Leaflet. Additionally, it supports layered visualizations and allows users to filter by height, zoning areas, and mixed-use categories.

- Access the Ciudad 3D platform or read more about its features via the following link.
This article was written by Belén Maiztegui. The translation is powered by AI.